Midterms Tuesday: what stocks did after the last 19
CAPITALS INSIDERS Markets, made simple — every weekday morning · Monday, November 2, 2026 | |
Good morning. On Tuesday, Americans vote in the midterm elections, after a month in which technology stocks had their worst stretch in a year and a half. Many readers have asked whether the election should change anything in a portfolio. History has a clear answer, and a few important caveats. | |
🔔 Opening Bell Friday: The S&P 500 fell –1.8% to 7,580.07, its worst day since June. The Nasdaq dropped –2.9% to 25,437.00 and the Dow –1.1% to 51,770.31. Intel lost almost 29%, its worst day since 1974. October: The Nasdaq fell 5.2%, its worst month since March 2025. The S&P 500 slipped 0.9%, while the Dow gained 1.7%, helped by health care and other defensive stocks. This morning: Futures rose about +0.4% to +0.8%. U.S. crude fell below $100 a barrel on signs of progress in talks with Iran, and the 10-year Treasury yield was 4.93%. | |
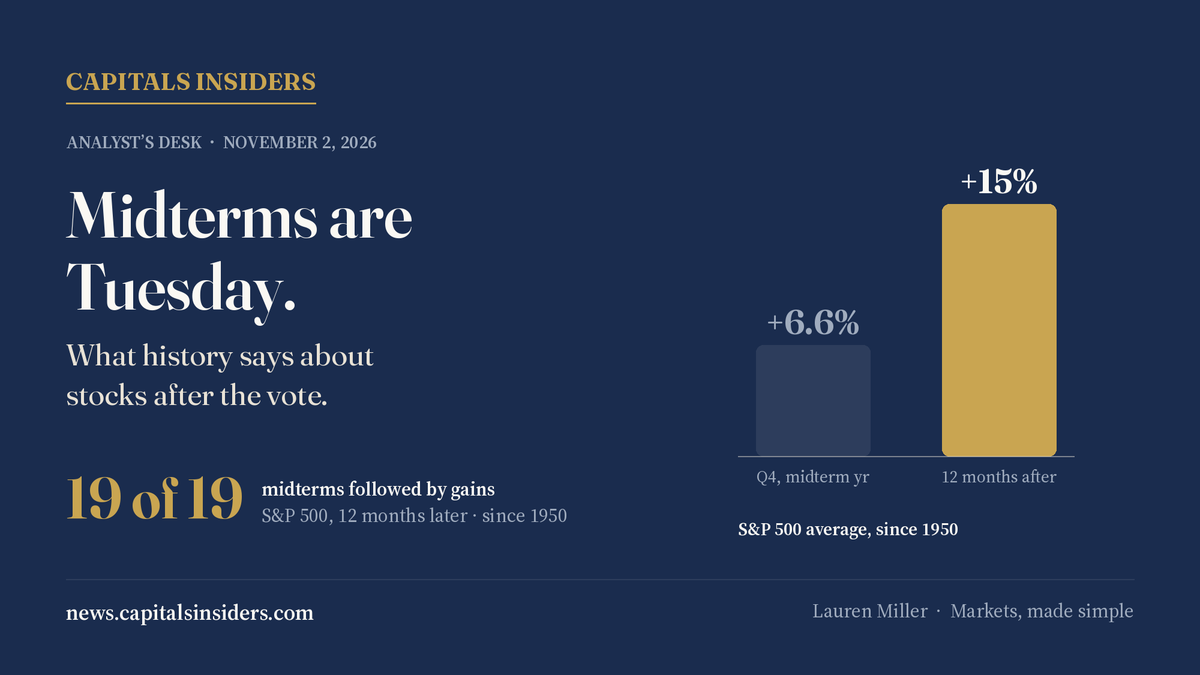
📊 Analyst's Desk Midterms are Tuesday. What history says about stocks afterward.  Start with the record. According to J.P. Morgan Asset Management, the S&P 500 has been higher 12 months after every midterm election since 1950, with an average gain of about 15%. Fidelity, using a longer history back to 1938, counts gains 95% of the time. The months right after the vote have also tended to be good: the fourth quarter of midterm years has averaged a 6.6% gain. “Markets don’t like uncertainty, and elections breed uncertainty.” Jordan Jackson, global market strategist, J.P. Morgan Asset Management The mechanism is mostly about uncertainty ending. Before an election, investors cannot know which policies will pass, so some wait. Once results are in, that hesitation fades, whatever the outcome. Midterms also often produce divided government, which makes sweeping changes to taxes and spending less likely. In early October, prediction markets Kalshi and Polymarket gave Democrats better than a 90% chance of winning the House and better than 60% for the Senate; those odds can move, and the pattern above has held under both parties.
WHY A PERFECT RECORD STILL NEEDS CAUTION Nineteen elections is a small sample. Each one came with a different economy, different interest rates and different valuations. A pattern that has never failed can still fail the next time, and it says nothing about what happens in the weeks around election day itself. This year has real differences. Stocks are expensive by long-term measures, with the Shiller price-to-earnings ratio near its second-highest level on record. The Fed is still raising rates. The AI trade that carried the market is under pressure, and the outcome of talks with Iran is uncertain. Any of those could matter more than the election. Here is what the numbers actually say. Elections have historically been a poor reason to make large portfolio changes, because the market has tended to rise regardless of which party won. The bigger drivers over the next year are likely to be earnings, interest rates and the price of oil, the same forces we have been following all autumn. | |
💵 Income Desk: I bonds now pay 5.51% The Treasury reset Series I savings bond rates on Friday for bonds bought from November 1 through April 30. Composite I bond rate 5.51% up from 4.26% Fixed rate, for the life of the bond 1.40% highest since November 2006 An I bond pays two parts. The fixed rate stays with the bond for up to 30 years; the inflation rate, now 4.08% annualized, resets every six months with consumer prices. That fixed rate is what makes this reset notable: it is the highest in 20 years. The limits matter too. You can buy up to $10,000 per person per year electronically through TreasuryDirect, you must hold the bond at least one year, and cashing out before five years costs the last three months of interest. Interest is exempt from state and local income taxes. I bonds are not traded, so their value does not fall when rates rise. | |
🧭 Market Sentiment & Calendar VIX volatility index 19.4 Monday morning Dow, October +1.7% Nasdaq: –5.2% October split the market in two: defensive and smaller companies held up while technology fell. Today, Nov. 2 ISM manufacturing survey; Apple and Palantir report after the close. Tue, Nov. 3 Midterm elections. Fri, Nov. 6 October jobs report. Wed, Dec. 9 Next Fed decision. | |
⚡ Quick Takes Apple tonight. Analysts expect earnings of $2.00 a share on revenue of about $113.5 billion, up from $1.85 and $102.5 billion a year earlier, according to Bloomberg consensus. Alphabet. Google's parent lost roughly half a trillion dollars of market value last week after its results, as management said AI is cutting into how much it earns from search. | |
📜 Wisdom of the Street “The investor’s chief problem — and even his worst enemy — is likely to be himself.” — Benjamin Graham Election week is a test of that line. The market has usually rewarded patience more than prediction. | |
Have a good day. — Lauren Miller, Capitals Insiders |